To address some questions and naysayers about Joel Morrow’s fuel economy and the chart, I wanted to offer some explanation.
First, about the lines. I took the average fuel economy of 6.5 MPG for dry van freight, as cited by the good folks at the North American Council on Freight Efficiency (NACFE), and used the average gross vehicle combination weight (GVCW) of 65,000 pounds, to establish the starting point. To establish the lines, I used Kevin Rutherford’s formula of 0.4% for every additional 1,000 pounds of weight. Mathematically, that’s:
6.5 MPG * (1 – 0.004)n,
where n is the weight – 65,000. Thus, we have a formula to calculate a normalized fuel economy curve based on weight and on the national dry van and reefer average fuel economy.
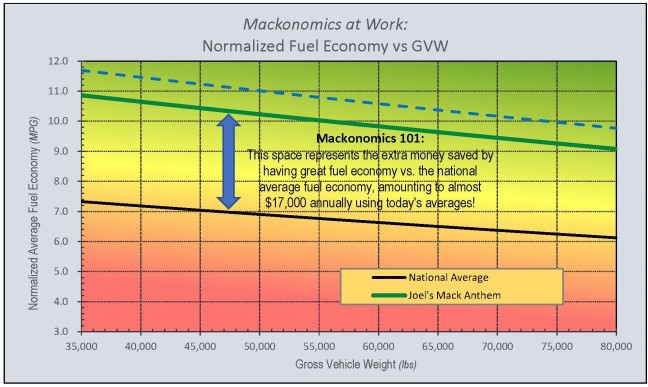
I similarly did the same thing with Joel Morrow’s 2020 Mack Anthem. I took his lifetime fuel economy from his fuel tickets and utilized his average GVW to establish the starting point, applied the same Rutherford formula to establish the normalized fuel economy line for all weights. I also established a ¾ MPG line premium to represent Joel’s fuel economy if he had an aerodynamic trailer (skirts and tail), so there would be a basis of comparison for those who run with aero trailing equipment.
As a weight normalized curve, it does not matter the weight in the truck. We now can see what that national average fuel economy is for every weight point, from deadhead at 35,000 to fully-loaded 80,000 pounds GVW. You can now use these lines as a benchmark to compare your operation against the national average and against one of the very best hyper-fuel milers on the road.
The take-aways from this chart are these:
- How is your operation doing compared to the national average? If it’s at or below the average, in the red zone, then first, let me thank you for establishing and maintaining a higher fuel surcharge for the rest of us. But more importantly, for your operation, is there something that can be done to improve your fuel efficiency?
- To the naysayers and other skeptics that rationalize fuel economies below Joel’s due to lighter weight, compare your fuel economy to Joel’s anywhere along his GVW-normalized fuel economy line.
- If you’re at 8 MPG and think that 10 MPG is not that much higher, consider that it is much harder to go from 8 to 9 MPG – or from 9 to 10 MPG – than it is to go from 7 to 8 MPG.
- Over the course of one year’s 110,000 miles, the difference between Joel’s fuel cost and the national average is nearly $17,000 annually! The small details matter, and I assure you that Joel is maximizing every scintilla of fuel economy possible.
- I humbly suggest learning from the best! He did not get to this enviable hyper-miler position all alone; he has the best technicians, Ken Gerber and John Kiser, at Ploger Transportation, at his disposal. He has worked extensively with many of the incredibly knowledgeable technical folks at Mack and Volvo. And he has pioneered with economy parameters, shift logic, engine torque management, throttle pedal response, suspension torque reactivity, tire footprints, fuel additives, oil viscosities, axle configurations and metallurgical optimization, and driver coaching tools such as PedalCoach, just to name a few.
Lastly, if for no other reason than a personal challenge, while we still have favorable Summer driving conditions, consider trying to attain better fuel economy. Reach for the stars! Try to catch Joel, even deadheading compared to his heavy-weight.
When I get my new truck in just a few short weeks, just as Joel does everything he can to maximize his fuel economy, so too, I will be doing the same to challenge Joel’s reign on fuel efficiency. He’s been warned; but I’m going to apply everything that I’ve learned from the master, himself, in a never-ending quest to improve fuel economy.
We’re all out here running the nation’s highways to earn a living and provide for our families. We, as prudent business- men and women, owe it to ourselves to do our very best to maximize our earnings potential. This chart shows what’s possible for all weights. Do your benchmarking. Now you’ll know how your performance measures against the national average and one of the top milers.

![Chicago-1[286] Back Cover](https://acosterus.files.wordpress.com/2017/03/chicago-1286-back-cover.jpg?w=648)
![Chicago-1[286] Back Cover](https://acosterus.files.wordpress.com/2017/03/chicago-1286-back-cover.jpg?w=313&h=309) rlapping. “The section between Douglas and Casper, had been shut down several times during the night and earlier in the day due to accidents. “But I had the real-time weather precipitation type and intensity superimposed on one GPS, while displaying the 30-40 mph crosswind overlaid on another GPS. When I slipped a time or two on the snow-packed lanes, I could see that I was in the very worst of the weather along my route; not to worry, I knew that the conditions were not expected to deteriorate any further. That information told me that I didn’t have to chain-up and could continue unabated. Had I not been so technologically equipped and fitted with the right tires, I might have exited and disappointed the customer.
rlapping. “The section between Douglas and Casper, had been shut down several times during the night and earlier in the day due to accidents. “But I had the real-time weather precipitation type and intensity superimposed on one GPS, while displaying the 30-40 mph crosswind overlaid on another GPS. When I slipped a time or two on the snow-packed lanes, I could see that I was in the very worst of the weather along my route; not to worry, I knew that the conditions were not expected to deteriorate any further. That information told me that I didn’t have to chain-up and could continue unabated. Had I not been so technologically equipped and fitted with the right tires, I might have exited and disappointed the customer.